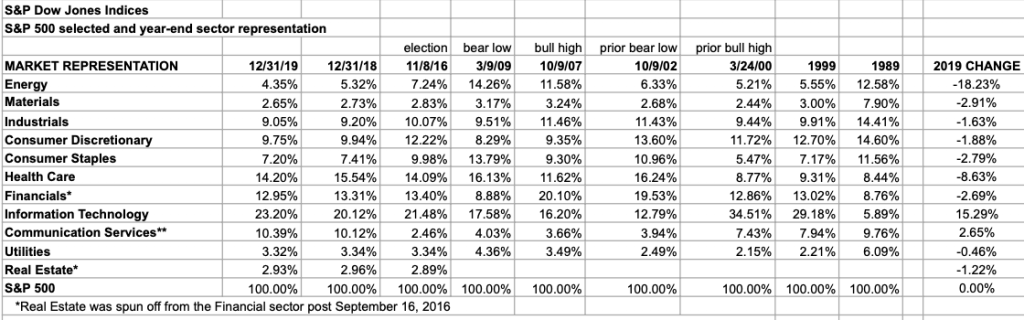
The S&P 500 index represents the 500 largest U.S. companies and it’s divided into 11 sectors. By looking at what each sector has contributed to the total value the index highlights important changes in the economy.
The energy sector has contact the most. In 1989 energy companies comprised 12.6% of the index. Today it’s 4.4%.
The information technology sector plus the communication sector represented 15.6% of the index in 1989. Today it’s 33.6%
Healthcare was 8.4% and is now 14.4%
There are several cross currents in these numbers. First, since the value of companies is driven by earnings, these figures show where money is being made. But because the value of companies are also driven by anticipated growth, these numbers also show the most promising areas of the economy.
Worth noting however, is that since tech, communications and to a degree healthcare companies have higher growth rates, means their share of total value is disproportionally affected growth instead of earnings. And that means their composition of the index is not at the expense of other companies’ earnings, but because the overall pie of value has been enlarged.